Windows Errors? Fix Them Before They Spread
Repair common Windows errors and clear accumulated junk for a smoother, more stable PC - no reinstall needed.Free scan · no reinstallOutdated Drivers Are Slowing You Down
One free scan finds every outdated or missing driver and matches the right update for your exact hardware.Free scan · exact hardware matchSome links on this page are affiliate links: if you buy through them we may earn a commission, at no extra cost to you.
If “biggest” means the most streaming minutes in the latest comparable U.S. measurement, the answer is Carrie (2026), followed by Below and East of Eden (2026). Nielsen’s chart for October 5–11, 2026 ranks those shows using total minutes viewed by people ages 2 and older, then places Ted Lasso, The Big Bang Theory, Bluey, SpongeBob SquarePants, Animals, Mayor of Kingstown and Bob’s Burgers.
That is a precise answer to “what is everyone streaming,” not a universal popularity or quality verdict. The list covers U.S. television-panel minutes, while Netflix’s separate global chart uses views and hours. Episode supply, catalog age, geography and service availability all change what a ranking means.
| # | Preview | Product | Price | |
|---|---|---|---|---|
| 1 |

|
The Andy Griffith Show: The Complete Series | $59.49 | Buy on Amazon |
| 2 |
|
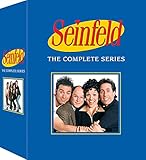
Seinfeld: Complete Series Box Set (Repackage) ? DVD | $82.96 | Buy on Amazon |
| 3 |

|
Home Improvement: The 20th Anniversary Complete Collection DVD Box Set | $109.99 | Buy on Amazon |
| 4 |

|
Anne of Green Gables Trilogy Box Set | $54.99 | Buy on Amazon |
What are the 10 biggest TV shows right now?
The table below uses Nielsen’s latest comparable U.S. overall streaming chart, covering October 5–11, 2026. Nielsen ranks streaming programs by total minutes viewed by persons 2 and older. The episode count is shown alongside each result because a deep catalog can accumulate minutes differently from a short, newly released series.
The Tool Desk
Outbyte Driver Updater FREEScan for outdated or missing drivers - takes under a minuteDriver Scan →Outbyte PC Repair FREERepair Windows errors before they cause bigger problemsFix Now →| Rank | Show | Minutes viewed (millions) | Episodes counted | Provider(s) | How to read the result |
|---|---|---|---|---|---|
| 1 | Carrie (2026) | 1,264 | 8 | Prime Video | A current limited series generating very high weekly use. |
| 2 | Below | 1,187 | 6 | Netflix | A breakout current title with strong momentum beyond the United States. |
| 3 | East of Eden (2026) | 1,162 | 7 | Netflix | A literary adaptation drawing sustained viewing from a relatively small episode pool. |
| 4 | Ted Lasso | 943 | 44 | Apple TV+ | A returning catalog or seasonal draw with many episodes available to play. |
| 5 | The Big Bang Theory | 812 | 279 | HBO Max | A long-running acquired catalog whose availability supports repeat viewing. |
| 6 | Bluey | 764 | 154 | Disney+ | A family franchise showing durable demand well after its initial releases. |
| 7 | SpongeBob SquarePants | 737 | 336 | Paramount+ | A large kids-and-family catalog continuing to generate substantial minutes. |
| 8 | Animals | 719 | 1 | Netflix | One episode accounting for this much viewing is notable even without a long catalog. |
| 9 | Mayor of Kingstown | 712 | 40 | Netflix; Paramount+ | Current interest supported by availability on two services. |
| 10 | Bob’s Burgers | 626 | 307 | Hulu | A deep animated catalog that benefits from repeat and background viewing. |
Nielsen describes this product as a way to discover the most-watched streaming originals, movies and acquired titles in the United States. Because it is a minutes-based ranking, it is best read as a measure of total viewing time rather than a headcount of individual fans.
Popular on Amazon
- Genre: TV Comedy
- Number of Discs: 39
- Number of Tracks: 0
- Playback Duration: 6397
- Director: Howard Morris^Aaron Ruben
What does “biggest” mean in this chart?
Here, “biggest” means the most minutes accumulated during one Nielsen week. It does not mean the most unique viewers, the highest completion rate, the best-reviewed show or the series with the largest social-media conversation.
Minutes are an engagement total, not a people count
A viewer who watches several episodes contributes more minutes than someone who samples one episode. A short series can therefore rank highly through concentrated use, while a long-running sitcom can build a large total through many repeat plays. Nielsen’s persons-2-and-older television-panel measure also describes U.S. viewing, not a worldwide audience.
Episode supply changes the comparison
The episode column is essential context. Animals appears with one counted episode, whereas Bob’s Burgers appears with a catalog of hundreds. Their positions show that the weekly total reflects both demand and how much material was available to watch in the measurement window.
Original, acquired and returning titles share one list
The chart intentionally puts current releases beside older acquired programs. That makes it useful for answering what people are actually watching on streaming services, but it prevents a simple “newest is biggest” conclusion. Four of the first eight entries are current originals or adaptations—Carrie, Below, East of Eden and Animals—while established titles fill the rest of the field.
Which shows are the clearest current breakouts?
Carrie (2026)
The Prime Video limited series leads the U.S. week despite having a finite episode run. Its placement illustrates how a concentrated release can generate a very large weekly minutes total without the decades-long library available to a sitcom.
Below
The Netflix title is the strongest cross-market signal in the data. It is high on Nielsen’s U.S. list and also leads Netflix’s worldwide English-language chart for the following week, suggesting that its attention was not confined to one country or one measurement system.
East of Eden (2026)
This Netflix adaptation shows that a literary source can translate into substantial streaming use when a new version gives audiences a finite story to watch. Its high position sits close to the two leaders, indicating sustained demand during the same release period.
Do these 3 things before closing this tab:
1Repair Windows errors before they cause bigger problems2Fix the driver behind crashes, sound loss and screen glitches3Clear out junk files and repair common Windows errorsAlso popular on Amazon
Animals
The Netflix entry is the unusual case in the top ten: Nielsen counted only one episode. Its appearance demonstrates why episode availability should be read beside every minutes ranking, particularly for specials, films presented as episodes or very short releases.
Why are older shows still among the biggest?
Catalog programming remains a major part of streaming behavior. Familiar episodes are easy to start, suitable for repeat viewing and often available in large quantities, so a show does not need to be a new release to produce a large weekly total.
Comfort viewing and deep libraries
The Big Bang Theory, Bluey, SpongeBob SquarePants and Bob’s Burgers all make the current top ten despite being acquired or long-running titles. Their positions reflect the value of a reliable library: viewers can watch one episode, continue for hours or return repeatedly without waiting for a new installment.
Why Ted Lasso matters
Ted Lasso sits between the new-breakout and deep-catalog cases. It is a returning or seasonal draw, but its available episode pool is much larger than that of the current limited series. Its ranking shows how a familiar series can re-enter the conversation when viewers revisit it or when renewed attention brings new households to the catalog.
What does Netflix’s global chart add?
Netflix’s own global English-language chart for October 12–18, 2026 provides a momentum check, not a replacement for Nielsen’s U.S. ranking. Netflix reports Below first with 21.2 million views and East of Eden second with 6.2 million. Instadocs: AI Gone Wild and TYSON follow with 5.1 million views each.
Below also led Netflix’s preceding week at 17.0 million views. That consecutive lead is useful evidence of continuing Netflix interest, but the number cannot be added to or directly ranked against Nielsen minutes. Netflix’s chart is global, uses views and hours, and can vary by country; Nielsen’s chart is a U.S. television-panel measure of minutes.
How should I choose a show from this list?
The rankings describe audience behavior. They do not establish which series is “best,” so use the viewing goal that fits your household.
Also popular on Amazon
- Want a current limited story? Start with Carrie, Below or East of Eden. Their finite episode pools make them easier to schedule as a defined watch.
- Want a show with continuing episodes? Choose Ted Lasso, Mayor of Kingstown or one of the long-running comedies. Their larger supplies support a longer viewing run.
- Watching with children? Bluey and SpongeBob SquarePants are the family-oriented entries in this chart. Check your local age ratings and the specific episode before viewing.
- Need a comfort rewatch? The Big Bang Theory or Bob’s Burgers offer extensive catalogs, while Bluey provides shorter animated episodes for quick sessions.
- Comparing services? The titles are spread across Prime Video, Netflix, Apple TV+, HBO Max, Disney+, Paramount+ and Hulu. Availability can change by country and over time, so confirm the listing in your market.
How do September and first-half measurements change the story?
A separate YouGov U.S. summary for September 2026 named Reacher the most-streamed title, followed by Grey’s Anatomy; Bluey was third and Ted Lasso fourth. Seven of YouGov’s top ten were new entries. That result differs because it covers a different month and uses a different methodology, reinforcing the need to label every “most watched” claim with its source and time window.
What’s actually slowing this PC down?
Pick the symptom - the matching free tool is one click away.
Longer-run context from TVLine’s summary of Nielsen data for December 29, 2025 through June 28, 2026 also produces a different picture. The period totals were 23.261 billion minutes for Stranger Things, 22.809 billion for Bluey, 21.118 billion for The Pitt, 20.414 billion for Grey’s Anatomy and 20.404 billion for The Big Bang Theory. Those are first-half figures, not the current weekly top ten, and they should not be presented as interchangeable with the October 5–11 chart.
How often does this list change?
Weekly streaming rankings are volatile. A newly released season, a finale, a licensing change or a viral recommendation can shift minutes quickly, while catalog shows may remain visible through steady repeat viewing. The figures and provider availability here were current to October 27, 2026, based on the October 5–11 Nielsen window and the October 12–18 Netflix window; a page still claiming to show what is “right now” should be refreshed within seven days.
Independent reader supportYour contribution helps us test, update, and keep practical guides available for everyone.What should I remember about this top ten?
Use the Nielsen table as a clearly labeled snapshot of U.S. streaming minutes, not as a universal league table. Current releases can surge, but deep catalogs remain powerful; and a separate global Netflix result can confirm momentum without being merged into the U.S. ranks. For a personal watch decision, treat the chart as a map of attention and then choose by format, episode supply, household needs and service access.
FAQ
Does Nielsen’s streaming chart include broadcast and cable viewing?
No. This particular list is an overall streaming chart, so a broadcast or traditional cable program can be absent even if it has a large linear-TV audience. Its absence means only that it did not appear in this streaming measurement, not that nobody watched it.
What does “persons 2+” mean in Nielsen’s description?
It means the measurement includes viewers age two and older in Nielsen’s U.S. television-panel estimate. The label does not provide a separate ranking for children, teens or adults, so demographic conclusions require a different Nielsen report.
Why can a one-episode title outrank a show with hundreds of episodes?
The ranking totals minutes, not episodes or average minutes per episode. A single episode can accumulate a large total when many people watch it during the same week, while a large catalog can spread its viewing across hundreds of installments.
Also popular on Amazon
Can I compare Netflix’s “views” directly with Nielsen’s minutes?
No. Netflix’s global chart counts views and reports hours, with country-specific availability, while Nielsen reports U.S. television-panel minutes. The two sources are useful as complementary signals, but they measure different audiences and behaviors.
Where can I check whether a title is available in my country?
Open the streaming service’s current catalog for your country before planning a watch. Rights and episode listings can change independently of a ranking, and Netflix specifically notes that some titles are not available in every region.
Frequently Asked Questions
Does Nielsen’s streaming chart include broadcast and cable viewing?
No. This particular list is an overall streaming chart, so a broadcast or traditional cable program can be absent even if it has a large linear-TV audience. Its absence means only that it did not appear in this streaming measurement, not that nobody watched it.
What does “persons 2+” mean in Nielsen’s description?
It means the measurement includes viewers age two and older in Nielsen’s U.S. television-panel estimate. The label does not provide a separate ranking for children, teens or adults, so demographic conclusions require a different Nielsen report.
Why can a one-episode title outrank a show with hundreds of episodes?
The ranking totals minutes, not episodes or average minutes per episode. A single episode can accumulate a large total when many people watch it during the same week, while a large catalog can spread its viewing across hundreds of installments.
Can I compare Netflix’s “views” directly with Nielsen’s minutes?
No. Netflix’s global chart counts views and reports hours, with country-specific availability, while Nielsen reports U.S. television-panel minutes. The two sources are useful as complementary signals, but they measure different audiences and behaviors.
Where can I check whether a title is available in my country?
Open the streaming service’s current catalog for your country before planning a watch. Rights and episode listings can change independently of a ranking, and Netflix specifically notes that some titles are not available in every region.
Quick Recap
Product prices and availability are accurate as of the date/time indicated and are subject to change. Any price and availability information displayed on Amazon at the time of purchase will apply.






Say something about this film