Free tools Windows power users keep installed
One-click scans. No signup required.
A premiere is building audience demand when people move through a measurable sequence: they discover the film, reserve or buy a ticket, attend, recommend or seek it out again, and then generate title-specific searches, bookings or viewing. Measure each step separately. A full room, a social-media spike or a platform view count alone cannot establish durable demand.
The practical method is to set a pre-premiere baseline, instrument the event, follow the audience for fixed periods afterward, and compare results with the film’s own prior levels and genuinely similar releases. Keep the geography, release window, denominator and metric definition visible in every report.
Define demand as a funnel, not a single score
Audience demand is a chain of behaviors rather than one universal number. A person can watch a trailer without booking, reserve a seat without attending, attend without recommending the film, or express enthusiasm in a survey without watching later. Those actions describe different stages and should not be merged unless you publish the weighting and calculation.
| Funnel stage | What to measure | What it can tell you |
|---|---|---|
| Discovery and interest | Title-specific searches, trailer or clip engagement, landing-page visits, ticket inquiries | Whether people are actively looking for the film before or after the premiere |
| Conversion | Reservations or purchases divided by eligible page visitors or inquiries | How efficiently interest becomes a booking |
| Attendance | Check-ins, no-shows, walk-ins and capacity utilization | Whether booked demand becomes physical participation |
| Advocacy and intent | Recommendation likelihood, sharing or rewatch intent, and open-ended responses | What the audience says it may do next and why it reacted |
| Follow-on behavior | Later searches, referrals, additional bookings, unique viewers, watch time and completion | Whether interest persists after the event |
Report the stages side by side instead of producing an opaque “demand score.” This prevents a large number of low-effort likes from masking weak attendance, or a small but highly engaged audience from being dismissed because its reach is modest.
Do these 3 things before closing this tab:
1Fix the driver behind crashes, sound loss and screen glitches2Repair Windows errors before they cause bigger problems3Scan for outdated or missing drivers - takes under a minute#1 Best Overall

- HD streaming made simple: With America’s number 1 TV streaming platform,* exploring popular apps—plus tons of free movies, shows, and live TV—is as easy as it is fun. *Based on hours streamed—Hypothesis Group
- Compact without compromises: The sleek design of Roku Streaming Stick won’t block neighboring HDMI ports, and it even powers from your TV alone, plugging into the back and staying out of sight. No wall outlet, no extra cords, no clutter.
- No more juggling remotes: Power up your TV, adjust the volume, and control your Roku device with one remote. Use your voice to quickly search, play entertainment, and more.
- Shows on the go: Take your TV to-go when traveling—without needing to log into someone else’s device.
- TV, simplified: With setup that only takes minutes, a simple-to-navigate Home Screen, and an uncluttered remote control that does all you need—Roku makes it easier to watch the TV you love.
Design the measurement before the premiere
Set the audience, market and window
Write down who the premiere is intended to reach, the geography covered by the event and the follow-up distribution, and the exact measurement windows. For example, you might use a 28-day pre-premiere baseline, an event-day report, and post-event windows of 24 hours, seven days and 28 days. Keep each market separate; a film can show stronger relative demand in one country than another.
Record the release type (single venue, festival screening, theatrical run, community event or online premiere), venue capacity, ticket price or free-entry status, distribution reach and comparable documentary releases. A local screening should not be compared with a wide release without stating the difference in reach and opportunity.
Capture a baseline
Before promotion accelerates, record title-specific search interest, trailer and campaign engagement, landing-page sessions, referrals and ticket inquiries or reservations where available. If your analytics allow it, split paid promotion from organic activity. Note the date range and platform for every number so a later change is not mistaken for a change in audience demand when it is actually a change in measurement coverage.
Choose comparable releases carefully
Comparisons are useful only when the titles share meaningful conditions: market, release format, audience scale, time window and distribution access. A documentary screened at one 200-seat venue is not a fair benchmark for a national platform launch. Preserve both absolute counts and rates, and state the denominator used for every rate.
Measure pre-premiere interest and booking conversion
Track title-specific discovery
Use searches for the film’s exact title, trailer or clip engagement, visits to the film’s screening or viewing page, referral sources and ticket inquiries. General interest in the subject is not the same as demand for the title, so distinguish title-specific terms from broad topic searches whenever the platform permits.
Calculate booking conversion with a stated denominator
Booking conversion is an operational measure, not a universal quality score:
Rank #2

- Ultra-speedy streaming: Roku Ultra is 30% faster than any other Roku player, delivering a lightning-fast interface and apps that launch in a snap.
- Cinematic streaming: This TV streaming device brings the movie theater to your living room with spectacular 4K, HDR10+, and Dolby Vision picture alongside immersive Dolby Atmos audio.
- The ultimate Roku remote: The rechargeable Roku Voice Remote Pro offers backlit buttons, hands-free voice controls, and a lost remote finder.
- No more fumbling in the dark: See what you’re pressing with backlit buttons.
- Say goodbye to batteries: Keep your remote powered for months on a single charge.
Booking conversion = reservations or purchases ÷ eligible page visitors or ticket inquiries × 100
Define “eligible” in the report. If a festival listing sends visitors to a separate ticket page, say whether the denominator includes only visitors who reached that page or everyone who viewed the festival listing. A raw total such as “350 tickets” is difficult to interpret without capacity, traffic, ticket price, campaign exposure and whether complimentary tickets are included.
Recommended Free Tools
Record exposure conditions
- Event date, venue, city and country.
- Capacity and number of sessions.
- Paid, free, discounted and complimentary ticket rules.
- Paid-media spend or impressions, if available, separated from organic traffic.
- Distribution restrictions, such as a geoblock or a platform release date.
- Comparable titles and the period against which they will be measured.
Separate reservations from actual attendance
Bookings and attendance answer different questions. A reservation shows that someone claimed or bought access; a check-in shows that the person actually appeared. Count both and show the relationship between them.
Arts Queensland’s Data Dictionary specifies counting each ticket holder as one attendee for a ticketed activity, including paid, unpaid and complimentary tickets, and counting people at the specific work rather than at a larger festival. For a premiere report, label that first measure “ticket holders” or “reservations” so readers do not confuse it with physical attendance.
| Event measure | Definition to publish | Why it matters |
|---|---|---|
| Reservations or tickets | All booked or issued places; state whether paid, unpaid and complimentary are included | Shows claimed demand before the event |
| Paid tickets | Reservations with a monetary charge, with currency and price basis | Separates willingness to pay from free access |
| Complimentary tickets | Invitations or zero-price allocations | Prevents free distribution from being mistaken for paid conversion |
| Check-ins | People recorded at the documentary’s screening | Measures actual attendance |
| No-shows | Reserved places without a check-in | Reveals leakage between booking and attendance |
| Walk-ins | People admitted without a prior reservation | Captures unplanned demand |
| Attendance rate | Check-ins ÷ ticket holders × 100 | Shows how reliably bookings became attendance |
| Capacity utilization | Check-ins ÷ available seats × 100; state whether blocked or reserved seats are excluded | Shows how much of the available room was used |
| Booking source | Ticket page, festival listing, partner, paid campaign, email or other tracked source | Identifies which discovery paths produced attendance |
Event-day procedure
- Export the ticketing list before doors open and freeze the event capacity used in the report.
- At check-in, scan or mark each attendee against the documentary’s own session, not the entire festival.
- Log walk-ins separately and record whether they paid, entered free or were added to a waiting list.
- After the screening, reconcile issued places, check-ins, no-shows and remaining capacity.
- Keep the raw counts and the formulas so another person can reproduce the attendance rate.
Ask for immediate feedback without confusing intent with behavior
Send a short, consistent survey while the screening is fresh. Useful questions include:
- How likely are you to recommend this documentary to someone interested in its subject?
- Do you intend to watch it again, share it or seek another screening?
- What prompted you to attend: a personal invitation, festival discovery, paid promotion, press coverage, a trailer or another source?
- What subject, scene or argument would you mention to another person?
- Which market or community would benefit from seeing it?
Publish the number invited, number responding and response rate. Keep recommendation intent, rewatch intent and open-ended comments as separate fields. A survey explains reaction and motivation, but a stated intention is not proof of a later booking, recommendation or view. Check those behaviors in the following days.
Rank #3

- 4K streaming made simple:With America’s number 1 TV streaming platform,* exploring popular apps—plus tons of free movies, shows, and live TV—is as easy as it is fun. *Based on hours streamed—Hypothesis Group
- 4K picture quality: With Roku Streaming Stick Plus, watch your favorites with brilliant 4K picture and vivid HDR color.
- Compact without compromises: Our sleek design won’t block neighboring HDMI ports, and it even powers from your TV alone, plugging into the back and staying out of sight. No wall outlet, no extra cords, no clutter.
- No more juggling remotes: Power up your TV, adjust the volume, and control your Roku device with one remote. Use your voice to quickly search, play entertainment, and more.
- Shows on the go: Take your TV to-go when traveling—without needing to log into someone else’s device.
Follow the audience after the premiere
Use fixed post-event windows
Track the same title-specific measures at consistent intervals, such as 24 hours, seven days and 28 days: searches, trailer or clip engagement, referrals to a screening or viewing page, additional bookings, platform-reported unique viewers, watch time, completion and geographic distribution. The exact windows can differ by release, but changing them between titles makes comparisons unreliable.
State what a “view” means
Platforms do not count views identically. Vimeo’s Streaming Analytics Metrics Glossary warns that reopening or reloading can start a new view and that deduplication of signed-out viewers is limited to the identifiers available to the platform. In each report, name the platform, date window, whether the number is unique viewers or total plays, and the watch-time or completion definition. A repeat play may indicate enthusiasm, or it may reflect the platform’s counting rule.
Keep social actions distinct
Likes, comments, shares, saves and link clicks require different amounts of effort and have different relationships to viewing. Do not add them together as interchangeable “engagement.” Parrot Analytics describes collecting signals from social media, social video, research activity and streaming or downloads, then weighting expressions by time and effort. Its technical guide states:
“Once captured, those inputs are then weighted by time and effort, so streaming or downloading a show is a higher expression of demand than a ‘like’ or comment related to that show.”
Quick wins for a faster PC:
Repair Windows errors before they cause bigger problemsFix Now →Fix the driver behind crashes, sound loss and screen glitchesFind Drivers →Clear out junk files and repair common Windows errorsFree Scan →Special offer. See more information about Outbyte and uninstall instructions. Please review EULA and Privacy policy.
That sentence describes Parrot Analytics’ methodology, not a universally validated rule. For your own reporting, show each action separately and explain any weighting you apply.
Watch for persistence, not only a spike
A premiere can generate a short-lived burst from press coverage, festival placement or a large campaign. Compare the post-event curve with the baseline and look for continued title-specific searches, new bookings, viewing and referrals after the initial spike. Persistence is evidence that interest survived the event; it is still not proof that the premiere alone caused the change.
Rank #4
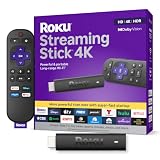
- Stunning 4K and Dolby Vision streaming made simple: With America’s number 1 TV streaming platform,* exploring popular apps—plus tons of free movies, shows, and live TV—is as easy as it is fun. *Based on hours streamed—Hypothesis Group
- Breathtaking picture quality: Stunningly sharp 4K picture brings out rich detail in your entertainment with four times the resolution of HD. Watch as colors pop off your screen and enjoy lifelike clarity with Dolby Vision and HDR10+.
- Seamless streaming for any room: With Roku Streaming Stick 4K, watch your favorite entertainment on any TV in the house, even in rooms farther from your router thanks to the long-range Wi-Fi receiver.
- Shows on the go: Take your TV to-go when traveling—without needing to log into someone else’s device.
- Compact without compromises: Our sleek design won’t block neighboring HDMI ports, so you can switch from streaming to gaming with ease. Plus, it’s designed to stay hidden behind your TV, keeping wires neatly out of sight
Build a transparent dashboard
A simple dashboard can be more credible than a proprietary-looking composite score. Include the following fields for every market and window:
| Field | Example format |
|---|---|
| Market and release window | City/country; 28 days before, event day, seven days after |
| Exposure | Landing-page visitors, source and paid/organic split |
| Bookings | Total reservations; paid and complimentary subtotals |
| Attendance | Check-ins, walk-ins, no-shows and available seats |
| Conversion rates | Booking conversion, attendance rate and capacity utilization, each with denominator |
| Audience response | Survey invitations, responses, response rate and each intent question |
| Follow-on behavior | Search index or count, referrals, unique viewers, plays, watch time and completion |
| Definitions | Platform, counting method, date range and any known limitations |
Illustrative calculation
Suppose a screening page receives 600 eligible visitors, 180 reservations are made, 150 people check in, 20 walk-ins are admitted and the room has 200 available seats. The booking conversion is 180 ÷ 600 = 30%. The attendance rate is 150 ÷ 180 = 83.3%. Capacity utilization based on check-ins is 150 ÷ 200 = 75%. Walk-ins should not be silently added to reservations; report them as a separate source of demand. These figures are an illustration of the formulas, not an industry benchmark.
Make three comparisons before drawing a conclusion
Compare with the film’s own baseline
Ask whether title-specific searches, trailer engagement, booking interest or viewing rose above the defined pre-premiere period. Use the same platform, geography and window where possible. A percentage lift without the underlying counts can exaggerate a change from a very small base, so publish both.
Compare stages of the funnel
Check whether discovery converted into bookings, bookings into attendance, attendance into recommendation intent and intent into later behavior. A high booking count with many no-shows points to a different problem than weak discovery with a nearly full conversion rate. Keep paid and complimentary access visible when judging conversion.
Compare with similar titles and markets
Use documentaries with similar release type, audience reach, geography and time window. Parrot Analytics’ product materials describe regional, adjustable-time-range and premiere-date comparisons, but its measures are proprietary and market-specific. Treat such comparisons as contextual evidence rather than a universal standard.
There is no independently validated, documentary-premiere-specific threshold for a “good” attendance rate, survey recommendation rate or post-premiere demand lift. Do not label a result successful because it crosses an invented cutoff.
The Tool Desk
Outbyte Driver Updater FREEScan for outdated or missing drivers - takes under a minuteDriver Scan →Outbyte PC Repair FREERepair Windows errors before they cause bigger problemsFix Now →Best Value

- The Google TV Streamer (4K) delivers your favorite entertainment quickly, easily, and personalized to you[1,2]
- HDMI 2.1 cable required (sold separately)
- See movies and TV shows from all your services right from your home screen[2]; and find new things to watch with tailored recommendations for everyone in your home based on their interests and viewing habits
- Watch live TV and access over 800 free channels from Pluto TV, Tubi, and more[3]; if you find an interesting show or movie on your TV, mobile app, or Google search, you can easily add it to your watchlist, so it’s ready when you are[2]
- Up to 4K HDR with Dolby Vision delivers captivating, true-to-life detail[4]; and you can connect speakers that support Dolby Atmos for more immersive 3D sound
Interpret vendor benchmarks with care
Parrot Analytics reports that its system receives activity from more than 2 billion people each day. That is a company-reported scope claim about its own data system, not an independently verified estimate of documentary audiences and not a required input to a filmmaker’s calculation.
Its demand-distribution page reports that 0.2% of titles fall into an “Exceptional” bucket, 64.1% are “Average” and 24.4% are “Below Average.” Those figures come from a proprietary vendor benchmark; the categories do not sum to 100%, so they should not be presented as exhaustive industry success rates.
Choose tools to match the release
Small or community premiere
Ticketing and check-in records, a short survey and consistent analytics from the viewing or ticket page may be sufficient. Use a spreadsheet with one row per market and window, preserve the raw exports and document definitions.
Festival or multi-venue release
Require a session-level identifier so attendance, capacity and booking source remain tied to the documentary’s own screening. A festival’s total attendance is not the film’s audience. Reconcile complimentary allocations and walk-ins across venues.
Larger distributor or research budget
Cinematik describes a workflow connecting listings, ticketing, booked-versus-attended data and post-event surveys. Movio Research describes ticket-purchase-based theatrical audience composition and release analysis. Parrot Analytics Movie Demand describes documentary genre filters, cross-market benchmarking and release-window comparisons. These are vendor descriptions, not independent proof that a service will improve demand, and access terms and pricing can change.
Quick Recap
Common measurement mistakes and fixes
- Calling reservations attendance: publish ticket holders and check-ins as separate measures.
- Counting a whole festival: count people at the documentary’s specific work or session.
- Using a raw booking total: add capacity, eligible traffic, ticket conditions and source.
- Adding likes, comments and views: report each action and its platform definition.
- Reporting a survey as proof of future behavior: link stated intent to later observed searches, bookings or viewing.
- Mixing markets: show geography and release timing instead of relying on a global aggregate.
- Claiming the premiere caused every increase: account for press, paid promotion, festival placement, distribution access and availability; use a pre-defined baseline or control group when causal attribution matters.
- Using an invented benchmark: state that no universal documentary-premiere threshold has been established.
A publication-ready reporting checklist
- Name the market, release type, event date and measurement windows.
- State the intended audience and the pre-premiere baseline period.
- Show traffic, searches, trailer activity and booking conversion with denominators.
- Separate paid, unpaid and complimentary ticket holders.
- Report check-ins, no-shows, walk-ins and capacity utilization separately.
- Publish survey invitations, responses, response rate and each intent measure.
- Define every platform’s view, unique-viewer, watch-time and completion metric.
- Track title-specific follow-on behavior at fixed intervals.
- Compare with the film’s baseline, the funnel’s stage-to-stage conversion and genuinely similar releases.
- State limitations, competing campaign activity and whether any vendor metric is proprietary.
Product prices and availability are accurate as of the date/time indicated and are subject to change. Any price and availability information displayed on Amazon at the time of purchase will apply.






Say something about this film